Big US Stocks’ Q2’18 Fundamentals
Adam Hamilton August 10, 2018 3974 Words
The mega-cap stocks that dominate the US markets are just finishing another monster earnings season. It wasn’t just profits that soared under Republicans’ big corporate tax cuts, but sales surged too. That’s no mean feat for massive mature companies, but sustained growth at this torrid pace is impossible. So peak-earnings fears continue to mount while valuations shoot even higher into dangerous bubble territory.
米国株式市場を支配する巨額資本金銘柄の巨額利益も終わりつつある。大きな利益の源は共和党の大幅法人減税のためだけでなく、売上急増をともなっていた。巨大な成熟企業がそう器用に立ち回ることはできず、この驚くほどのペースでの成長持続は無理だ。というわけでpeak earningsの懸念が湧き上がっている、一方でバリエーションは危険なバブル域の高みにある。
Four times a year publicly-traded companies release treasure troves of valuable information in the form of quarterly reports. Required by the US Securities and Exchange Commission, these 10-Qs contain the best fundamental data available to investors and speculators. They dispel all the sentimental distortions inevitably surrounding prevailing stock-price levels, revealing the underlying hard fundamental realities.
公開企業は年に4回四半期決算を開示する、貴重な情報の宝庫だ。米国SECの求める10−Q書類には投資家投機筋にっとって最良のファンダメンタルズが記されている。これを読むことで株価を巡る心理的な歪みを取り除くことができる、企業業績の背景にある現実のファンダメンタルズが明らかになる。
The deadline for filing 10-Qs for “large accelerated filers” is 40 days after fiscal quarter-ends. The SEC defines this as companies with market capitalizations over $700m. That currently includes every single stock in the flagship S&P 500 stock index, which includes the biggest and best American companies. As Q2’18 ended, the smallest SPX stock had a market cap of $4.1b which was 1/225th the size of leader Apple.
10−Q書式の提出しめきりは「大企業に対して」は四半期終了後40日だ。SECはこれらの企業を資本金$700M以上と定義している。現在ではS&P500構成銘柄すべてがこれに該当する。2018Q2終了時点で、SPXの最小時価総額銘柄は$4.1Bであり、一番のAppleの1/225の規模だった。
The middle of this week marked 39 days since the end of calendar Q2, so almost all of the big US stocks of the S&P 500 have reported. The exceptions are companies running fiscal quarters out of sync with calendar quarters. Walmart, Home Depot, Cisco, and NVIDIA have fiscal quarters ending a month after calendar ones, so their “Q2” results weren’t out yet as of this Wednesday. They’ll arrive in coming weeks.
今週半ばでQ2終了から39日を過ぎており、S&P500構成銘柄の殆どは決算開示している。例外となるのは会計年度が暦年と異なる銘柄だ。Walmart , Home Depot、CiscoそしてNVIDIAはひと月おくれの会計年度のために、「Q2」決算は水曜時点で開示されていない。もうすぐ開示するだろう。
The S&P 500 (SPX) is the world’s most-important stock index by far, weighting the best US companies by market capitalization. So not surprisingly the world’s largest and most-important ETF is the SPY SPDR S&P 500 ETF which tracks the SPX. This week it had huge net assets of $271.3b! The IVV iShares Core S&P 500 ETF and VOO Vanguard S&P 500 ETF also track the SPX with $155.9b and $96.6b of net assets.
SPXは世界で最も重要な株式指数であり、時価総額の大きい米国企業を組み込んでいる。そのため、驚くことではないが世界最大のETFはSPXだ今週時点で時価総額は$271.3Bにもなる!同様にSPXを追跡するIVVは$155.9B、VOOは$96.6Bの時価総額を有する。
The vast majority of investors own the big US stocks of the SPX, as they are the top holdings of nearly all investment funds. So if you are in the US markets at all, including with retirement capital, the fortunes of the big US stocks are very important for your overall wealth. Thus once a quarter after earnings season it’s essential to check in to see how they are faring fundamentally. Their results also portend stock-price trends.
圧倒的多数の投資家がSPX構成大型銘柄を持っている、というのもほとんどどの投資ファンドもこれを一番に組み込んでいるからだ。そのためみなさんが米国市場に投資しているなら、これら米国大型銘柄の動向が資産価値を大きく左右する。しかるに四半期決算開示後にこれらの銘柄のファンダメンタルズを確認するのは大切なことだ。その結果が結局株価動向の前兆となる。
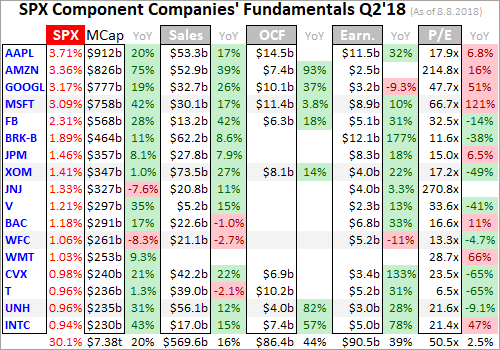
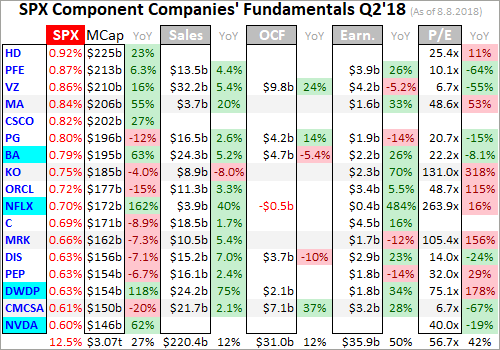
Unfortunately my small financial-research company lacks the manpower to analyze all 500 SPX stocks in SPY each quarter. Support our business with enough newsletter subscriptions, and I would gladly hire the people necessary to do it. For now we’re digging into the top 34 SPX/SPY components ranked by market capitalization. That’s an arbitrary number that fits neatly into the tables below, and a dominant sample.
残念なことに、私の小さな金融市場調査会社ではSPX構成500銘柄全部を分析するほどのマンパワーを欠いている。有料記事購読者が十分あれば、私は喜んでそういう人を雇うだろう。今の所時価総額でSPX上位34銘柄の分析にとどまる。この結果の一部を下の表に示している、数は少ないがこれでも十分なサンプルとなる。
As of the end of Q2’18 on June 29th, these 34 companies accounted for a staggering 42.6% of the total weighting in SPY and the SPX itself! These are the mightiest of American companies, the widely-held mega-cap stocks everyone knows and loves. For comparison, it took the bottom 431 SPX companies to match its top 34 stocks’ weighting! The entire stock markets greatly depend on how the big US stocks are doing.
2018Q2末において、これら34銘柄だけでSPY時価総額の42.6%にもなる!これらは米国最強企業だ、誰もがよく知る巨額時価総額銘柄だ。比較のために言えば、SPX下位431銘柄の時価総額と上位34銘柄の時価総額と同等だ!市場全体が米国大企業に依存している。
Every quarter I wade through the 10-Q SEC filings of these top SPX companies for a ton of fundamental data I dump into a spreadsheet for analysis. The highlights make it into these tables below. They start with each company’s symbol, weighting in the SPX and SPY, and market cap as of the final trading day of Q2’18. That’s followed by the year-over-year change in each company’s market capitalization, a critical metric.
毎四半期、私はこれらのSPX上位銘柄の10−Q書類を分析し多量のデータをスプレッドシートに転載して分析する。下の表はその重要な部分だ。この表の最初の項目は銘柄シンボル、SPXの時価総額割合、そして2018Q2における時価総額だ。その次が各銘柄の時価総額のYoY変化だ、これは重要な指標だ。
Major US corporations have been engaged in a wildly-unprecedented stock-buyback binge ever since the Fed forced interest rates to deep artificial lows during 2008’s stock panic. Thus the appreciation in their share prices also reflects shrinking shares outstanding. Looking at market-cap changes instead of just underlying share-price changes effectively normalizes out stock buybacks, offering purer views of value.
2008年の株式混乱以来FEDが金利を人工的に極端に安くしたために、米国大企業では極端な自社株買いが流行している。しかるに、流通株式が減ることで株価が上昇している。株価を見るのではなく時価総額を見ることで自社株買いの効果を取り除くことができる、純粋な企業価値を示している。
That’s followed by quarterly sales along with their YoY changes. Top-line revenues are one of the best indicators of businesses’ health. While profits can be easily manipulated quarter-to-quarter by playing with all kinds of accounting estimates, sales are tougher to artificially inflate. Ultimately sales growth is necessary for companies to expand, as bottom-line earnings growth driven by cost-cutting is inherently limited.
その次が四半期売上とそのYoY変化だ。決算書最上段の売上はビジネスの健全性を示す最良指標だ。会計上の操作でYoY利益変化は簡単に操作できるが、売上は意図的に膨らますことはできない。企業の業績拡大には売上増加が絶対必要だ、コスト削減による決算書最下段の利益成長には限界がある。
Operating cash flows are also important, showing how much capital companies’ businesses are actually generating. Using cash to make more cash is a core tenet of capitalism. Unfortunately most companies are now obscuring quarterly OCFs by reporting them in year-to-date terms, which lumps in multiple quarters together. So these tables only include Q2 operating cash flows if specifically broken out by companies.
営業キャッシュフローもまた重要な指標だ、これをみることで本業で生み出される資金を見ることができる。資本が資本を生み出すというのが資本主義の本質だ。残念なことに殆どの企業は今や四半期のOCFを分かりづらくして年初来で示している、それまでの四半期のデータを合算したものだ。というわけでもし特別に企業が個別に示している場合は、この表ではQ2のみの営業利益を示している。
Next are the actual hard quarterly earnings that must be reported to the SEC under Generally Accepted Accounting Principles. Late in bull markets, companies tend to use fake pro-forma earnings to downplay real GAAP results. These are derided as EBS earnings, Everything but the Bad Stuff! Companies often arbitrarily ignore certain expenses on a pro-forma basis to artificially boost their profits, which is very misleading.
その次はGAAPによるSEC報告の四半期収益だ。ブル相場の終盤になると、企業はGAAP決算とは異なる形式的な収益を開示する傾向にある。こういうことをEBS決算という、Everything but the Bad Stuffということだ!企業は度々形式的にある種の費用を意図的に無視することがある、利益を増やすためだ、こういうことをされると大きな誤解を生む。
While we’re also collecting the earnings-per-share data Wall Street loves, it’s more important to consider total profits. Stock buybacks are executed to manipulate EPS higher, because the shares-outstanding denominator of its calculation shrinks as shares are repurchased. Raw profits are a cleaner measure, again effectively neutralizing the impacts of stock buybacks. They better reflect underlying business performance.
Wall Streetが大好きなEPSを私どもも収集するが、もっと大切なことは全収益だ。EPSを高く見えるように操作するために自社株買いが行われる、自社株買いによりEPSの分母を小さくするからだ。生の利益はより明確な指標となる、繰り返すが自社株買いの効果を打ち消してしまう。これを見ることで自社ビジネスをよく反映している。
Finally the trailing-twelve-month price-to-earnings ratio as of the end of Q2’18 is noted. TTM P/Es look at the last four reported quarters of actual GAAP profits compared to prevailing stock prices. They are the gold-standard metric for valuations. Wall Street often intentionally obscures these hard P/Es by using the fictional forward P/Es instead, which are literally mere guesses about future profits that often prove far too optimistic.
最後に示すのがTTM PERだ、2018Q2時点のものだ。TTM PERは直近4半期のGAAP利益を株価と比べたものだ。これがバリエーションに関する黄金律だ。Wall Streetは意図的にこの厳格なEPSを架空の産物である予想PERに置き換える、これは文字通り推測であり多くの場合楽観的な将来の利益を利用している。
Not surprisingly in the second quarter under this new slashed-corporate-taxes regime, many of the mega-cap US stocks reported spectacular Q2’18 results. For the most part sales, OCFs, and earnings surged dramatically. The big problem is such blistering tax-cut-driven growth rates are impossible to sustain for long at the vast scales these huge companies operate at. Downside risks are serious with bubble valuations.
驚くことではないが、第二四半期には今回の新たな法人減税が適用されており、多くの大企業は素晴らしい2018Q2決算を開示している。多くの場合、売上、OCFそして収益は劇的に増えている。大きな問題はこの素晴らしい減税による成長は長期に渡り持続可能なものではないということだ。バブルバリエーションのために下落リスクは深刻だ。


