長い記事なので後半の興味ある部分だけを訳します。「完全な嵐」以降です。前半はチャート解説なので、チャートをみるだけで理解できるでしょう。
Bull Rallies In Bear Markets - The Perfect Storm

Submitted by Lance Roberts via RealInvestentAdvice.com,
In last week’s missives, I discussed the potential for an oversold, short-covering bounce which was to be used to further rebalance portfolios and reduce equity risk. The target zone was 1940 to allow for the completion of the “risk reduction” process.
“That rally could take the markets back to the previous resistance of 1940 (about a 4% push) from current levels. Such a rally would be enough to suck many of the “bulls” back into the markets pushing markets back into overbought territory and setting up the next decline.”
Chart updated through Friday’s close:
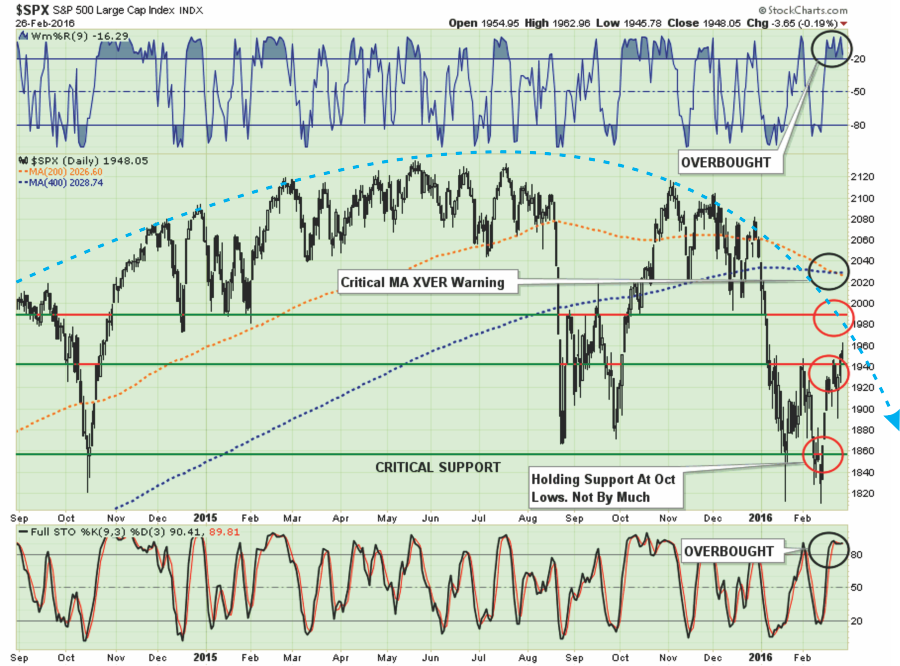
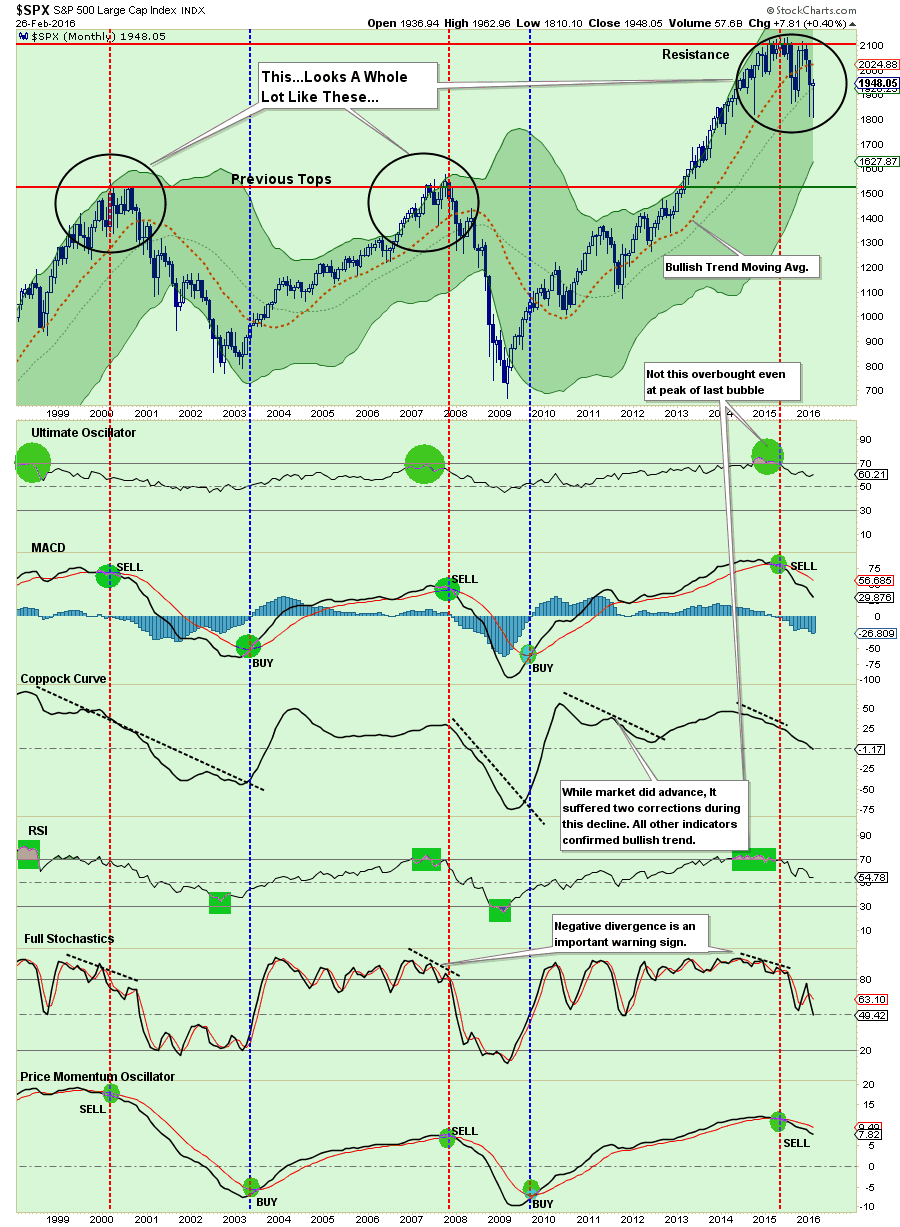
The good news is that the market was able to break above 1940, and the 50-dma, which now clears the way for a push to the 1970-1990 where the next levels of resistance will be found.
The bad news is that the markets are once again extremely overbought and still confined inside of an overall downtrend.
Importantly, as I predicted last week, the 200 and 400-dma has crossed into bearish territory for the first time since the financial crisis. While such a “cross” is not necessarily a signal of the onset of a new cyclical bear market, it does apply yet another level of downward pressure on stock prices.
The next chart lays out the most probable path of the current bull rally within the confines of an overall bearish trend.
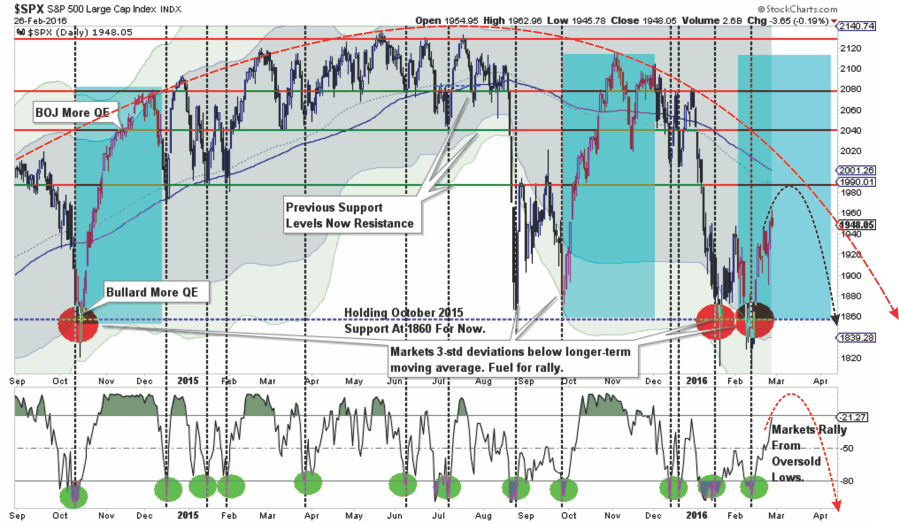
There are quite a few moving pieces here, so let me explain.
- The shaded areas represent 2 and 3-standard deviations of price movement from the 125-day moving average. I am using a longer-term moving average here to represent more extreme price extensions of the index. The
last 4-times prices were 3-standard deviations below the moving
average, the subsequent rallies were very sharp as short-positions were
forced to cover. The vertical blue bars show the previous two
periods where bulls regained footing and pushed markets from lows
towards new highs. The current setup is indeed similar to those previous
two attempts. All we are lacking is some serious “jawboning” from a Fed official about accommodative support to push markets higher.
- The bottom of the chart shows the overbought/sold conditions of the
market. The vertical dashed lines show that oversold conditions lead to
fairly sharp rallies. The recent rally, while the “best rally of the year,” has responded as expected from recent oversold conditions. With the oversold condition now exhausted, the potential for further upside has been reduced.
- With the 125-day moving average trading below the 150-dma, and with both averages declining rather than advancing, the easiest path for prices continues to be lower as downward resistance continues to be built. The arching dashed red line shows the change of overall advancing to now declining price trends.
As I stated, such an advance would correspond with a rally within the ongoing downtrend and sets the markets up for the next retest of recent lows.
But that is must my opinion. There were some really good confirming bits of technical analysis out this past week as well worth sharing with you.
NO BREAKOUT FOR THE BULLS
Northman Trader had an interesting technical post on Friday showing the technical breakdown of the market from several perspectives. The first, as shown below, is that while the markets closed below the important 1950 level, it did manage to stay above the 50-dma but just barely.
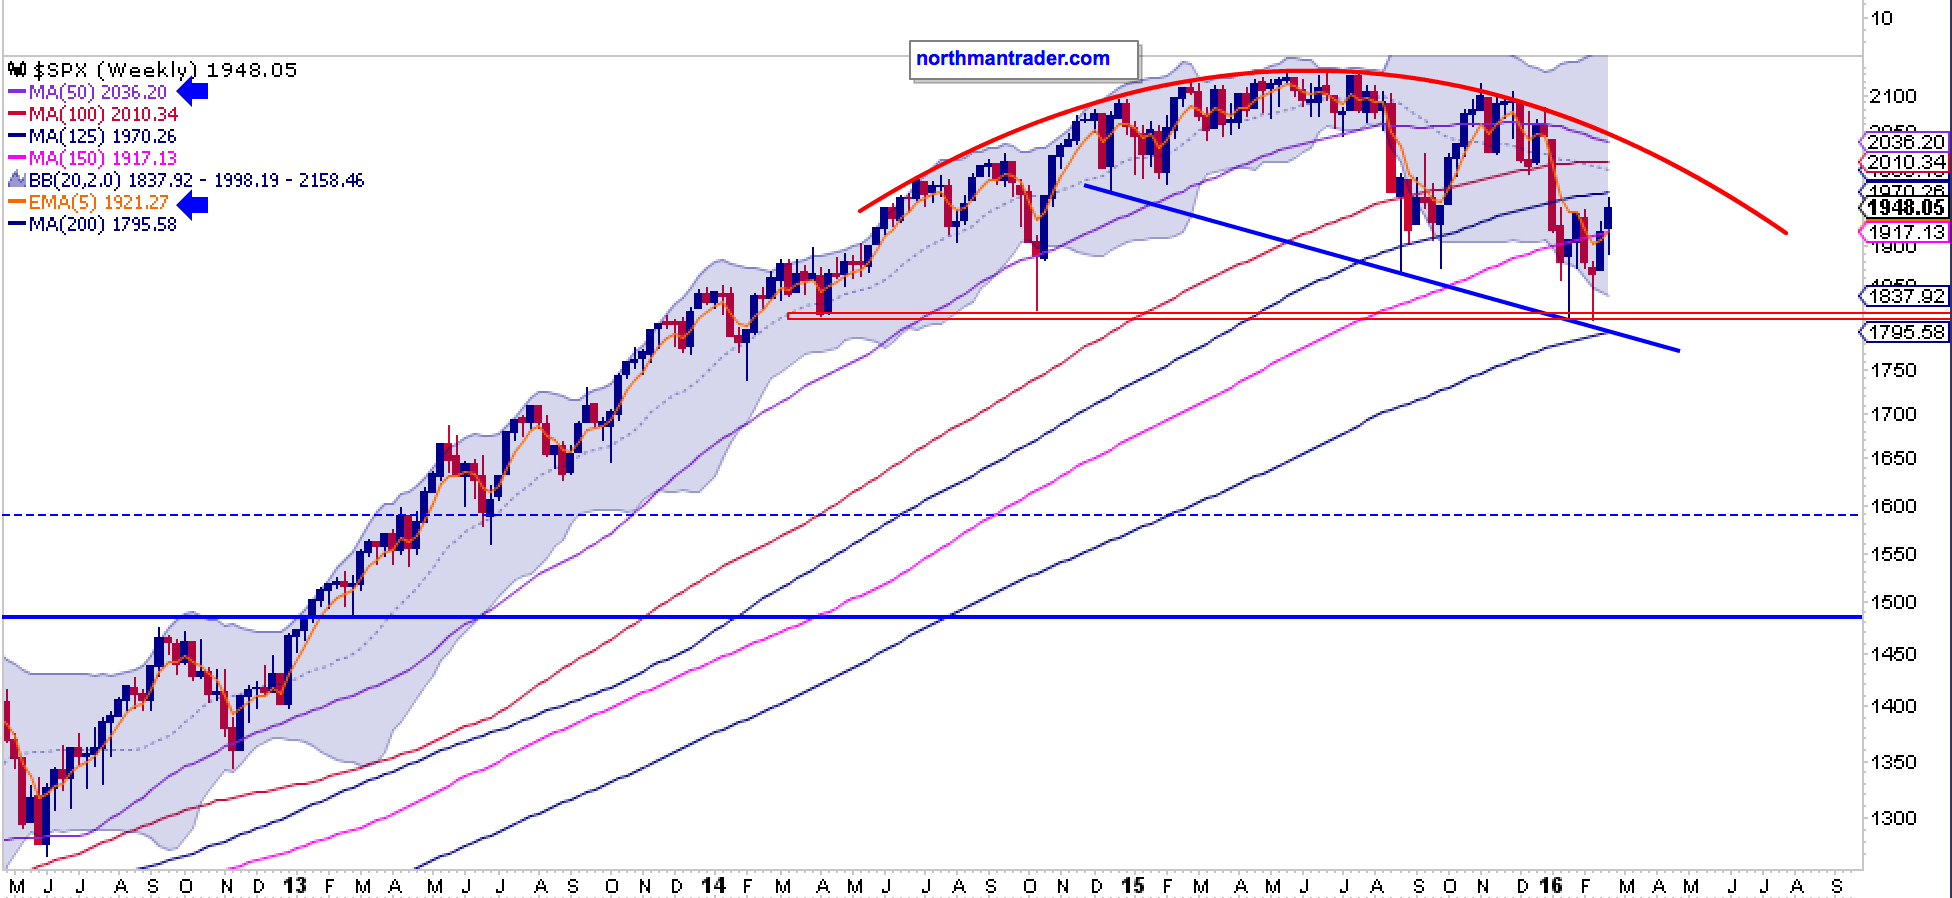
Importantly, Northy also noted the topping pattern I discussed above along with the critical support levels going back to March and October 2014 lows.
But here is the most important point he makes:
“$SPX monthly chart: Unless the $SPX has a miracle rally on Monday it will close the month not having touched its monthly 5 EMA from the underside for the first time since 2009:“
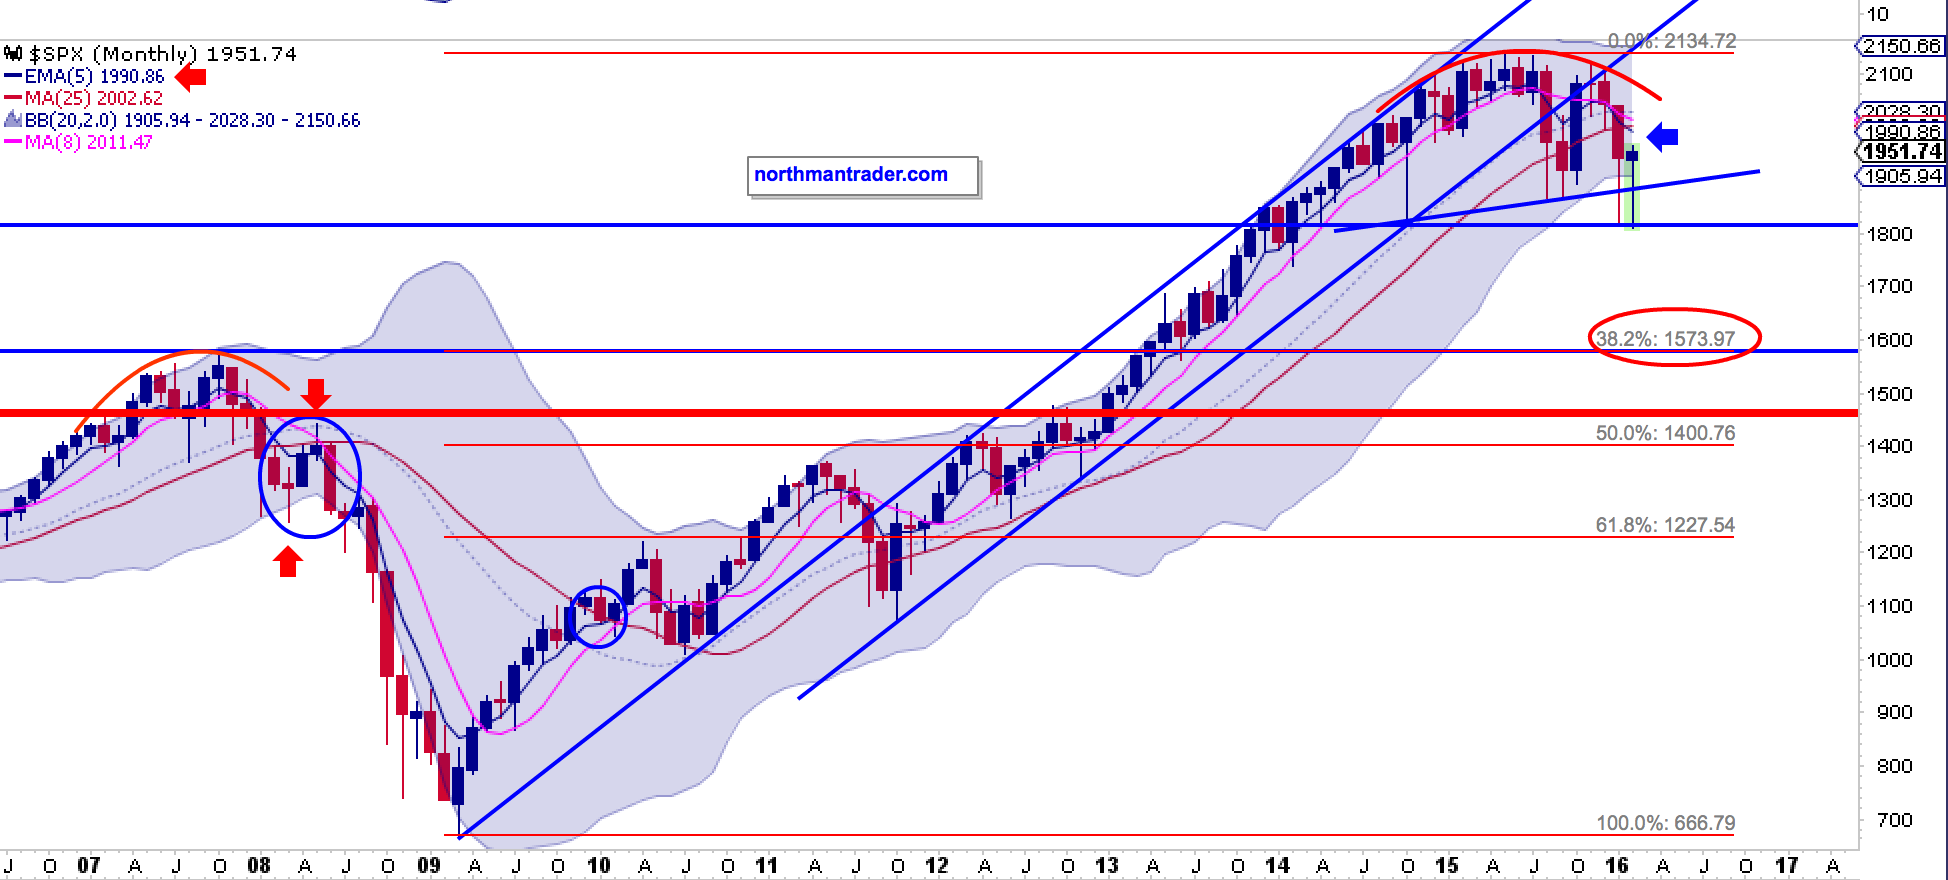
What Northy notes in the chart above is the same message I have discussed over the past couple of months. That message is simple:
“The market is currently suggesting that the bull market began in 2009 has now come to its inevitable conclusion.”
THE PERFECT STORM
完全な嵐
Erin Heim from Decision Point, recently penned an excellent analysis also suggesting that the recent bull rally is NOT the beginning of a new bull market cycle. To wit:
Erin Heimが決断の時と題して優れた分析記事を書いている、最近のブルラリーは決して新たなブル市場の始まりではないと言う。確認しよう:
“Indicators in all time-frames don’t always coordinate with each other, but I believe they are beginning to meld right now. I noticed each time-frame was becoming extremely overbought.
「指標というのはいつでも完全な相関を持つものではない、しかし私はいろいろな指標がおなじ符丁を示し始めたと信じている。私はどの時間軸で見ても株式は買われ過ぎであることに気づいた。
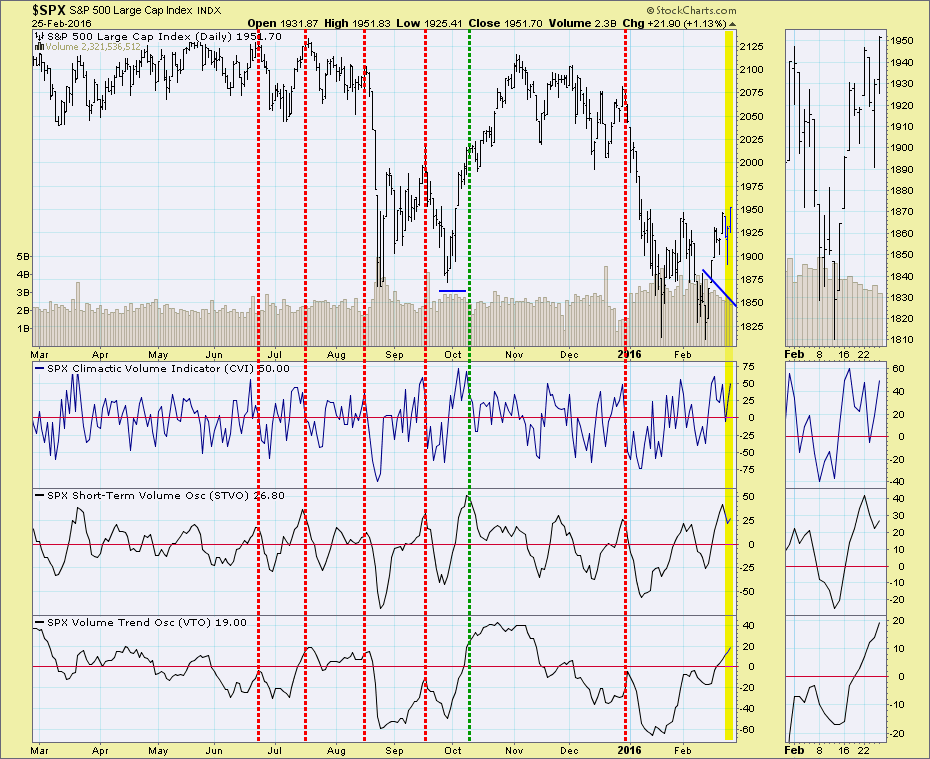
The first chart shows the On Balance Volume Indicator Suite made up of the Climactic Volume Indicator(CVI), Short-Term Volume Oscillator (STVO) and the Volume Trend Oscillator (VTO). As I said, they don’t often peak at the same time. Dragging a vertical line across the chart, I marked overbought readings peaking at the same time. The result? A price top. But wait, it’s important to point out the green line. There are undeniable similarities in price pattern and indicators that preceded another leg up. However, note volume behavior (blue lines). There is a distinct difference. Volume stayed fairly even during the preceding rally and in this case, volume has been drifting lower.“
最初のチャートは取引量指数を示す、Climactic Volume Indicator(CVI)、Short-Term Volume Oscillator(STVO)そしてVolume Trend Oscillator(VTO)だ。これまでも行ってきたが、これらの指標が同時にピークを持つことはあまりない。チャートの縦線を見てほしい、買われすぎビークに注目している。結果はどうだろう?みごとに株価の頂点にあっている。しかし緑の線に注目してほしい、これが大切だ。価格と指数の間の相関は否定しづらい、他の上昇と同様だ。しかし単純な取引量を見てほしい(青い横線だ)。ここには明らかな違いがある。ここでは価格上昇にもかかわらず明らかに出来高が減っている、
“Here’s a three-year chart using the Price Momentum Oscillator (PMO), Swenlin Trading Oscillator – Breadth (STO-B) and Intermediate-Term Breadth Momentum Oscillator (ITBM). These indicators don’t line up very often. The last yellow bar uses a short-term overbought peak for the ITBM with the same result.”
「下のチャートはこの3年のPrice Momentum Oscillator(PMO)、Swenlin Trading Oscilator Breadth(STO-B)そしてIntemediate-Term Breadth Momentum Oscillator(ITBM)だ。これらの指数がそろって同じ傾向を示すことはあまりない。直近の黄色の帯はITBMの短期的な買われ過ぎを表す。」

“Conclusion: When all three time-frames become this overbought at the same time, we usually see a correction or sizable decline. Last time on the CVI/STVO/VTO chart, it was a continuation rally; however, volume decreasing on the current rally indicates a decline is more likely.”
「結論:この時間軸の異なる3つのチャートで同時に買われすぎ指標となっている、これを見れば調整かかなりな価格後退が起こると考えざるを得ない。最後にCVI/STVO/VTOチャートでラリーが生じた時には、取引高の下落を伴っており、下落の可能性が高い。」
DON’T BUY THE “BUY & HOLD” LINE OF B.S.
バフェットが売る価格帯を超えて「バイアンドホールド」作戦の買いを進めるな。
I recently penned an entire article on the fallacy of buy and hold investing. However, my friend Jesse Felder via the Felder Report did a super job of reiterating the point this week.
私は最近、「バイアンドホールド戦略の間違い」という記事を書いた。そこで、私の友人Jesse Felderが私の主張の要点をさらに上手に書き記してくれた。
“Far more money has been lost by investors preparing for corrections, or trying to anticipate corrections, than has been lost in corrections themselves.” – Peter Lynch
「株価調整で実際に失う額よりも、投資家が株価調整に備えて、もしくは株価調整を心配して失う資金の方が大きい」ーーPeter Lynch
“This quote has been making the rounds since the market’s 2% decline last Thursday. It’s a great quote; I’m a huge Peter Lynch fan. I’ve read each of his books at least twice and recommend them enthusiastically.
「この引用は先週火曜の2%後退程度のときには正しい。素晴らしい明言だ:私もPeter Lynchが大好きだ。私は彼の本はどれも二度は読んだ、皆にこの本を勧めている。
However, I think there’s an important point to be made here. Peter Lynch managed money professionally from 1977 to 1990 putting up an amazing track record: 29% average annual returns. No doubt this places him in a very elite class of the most skilled investors ever. But he also had a massive tailwind to work with as the stock market was very attractively valued during his entire career.
しかしながら、留意しなければならない大切なことがあると私は考えている。Peter Lynch が職業として資産運用を行ったのは1977から1990のことで、素晴らしい成績を残している:年率平均で29%のリターン記録だ。この記録をみると彼がもっとも優れた投資家のひとりとして認められることに疑いはない。しかし、彼はまたとんでもない株式市場の追い風を受けていた、彼が活躍した期間には株式市場はとんでもなく魅力的だったのだ。
Below is a chart of the total stock market value relative to GDP (via Doug Short). I’ve circled the area that represents Lynch’s career in red:”
下のチャートは株式市場時価総額をGDPで割った値を示す。Lynchが活躍した時期を赤線で囲んでいる:」
“Over the past couple of decades there was maybe only a single month, at the very bottom of the financial crisis, during which stock market valuations neared the levels that Peter Lynch had to work with. And even then those levels, of about 60% market cap to GDP – that we considered cheap, during his career represented the month just before the 1987 crash!
「この20年ほどの間では一月ほどしか無かったことだが、金融危機の大底の一月だ、この時期しかPeter Lynchが活躍した時代と同じ株式バリュエーションのことはなかった。現在では株式し時価総額がGDPの60%の時には株価はとても安いと感じる、Peter Lynchは1987年の暴落のひと月前に引退している、時価総額がGDPの60%に達するひと月前だ!
Considering what investors have gone through since Lynch retired, the aftermath of the internet bubble, housing bubble and financial crisis, I think it would be very difficult to make the case that they lost far more money over the past couple of decades trying to sidestep these debacles than the money lost by those who didn’t sidestep them.“
Lynchが引退してからの株式市場がどうだったかを考えてほしい、インターネット・バブル、住宅バブル、金融危機と続いた、資金を失わないところか維持することでさえ容易では無いだろう。」
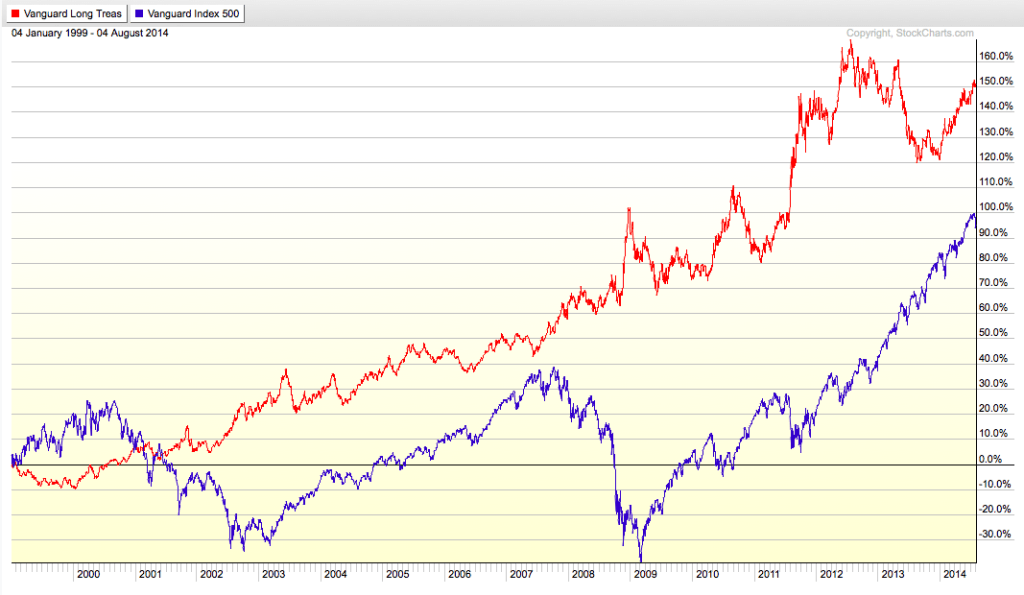
“When Treasury Bonds far outperform stocks over a 15 year period, I’d say sidestepping the madness of these markets has paid off fairly well. And considering the fact that stocks are now, once again overvalued to the point that an investor can expect roughly a 0% return over the coming decade, I’d say it will probably pay to sidestep it once again.”
「この15年、米国債のほうが株式市場を凌駕しているときに、この市場の混乱を回避せずに利益を上げるのは容易ではない。考えても見てほしい今や株式市場はまたもや過剰評価の時を迎え、今後10年はリターンが望めないレベルまで買い進まれている、またもや市場混乱を回避する時が訪れている。」
Jesse has this absolutely right. The essence of “buy and hold investing” has been corrupted by Wall Street in the endeavor to turn a traditionally commissioned based business into an “annuity stream.” This is great for Wall Street, but bad for you.
Jesseの論点は全く正しい。「バイアンドホールド」戦略の本質はWall Streetの方便でしかない、伝統的なコミッションベースビジネスを安泰とするためのものだ。Wall Stereetにとっては素晴らしいビジネスモデルだ、でもあなたにとっては最悪。
The truth of “buy and hold” investing was best summed up in the following quote:
「バイアンドホールド」戦略の真実は以下の明言で言い尽くされている:
“Buy when everyone else is selling and hold until everyone else is buying. This is more than just a catch slogan. It is the very essence of successful investing.” – J Paul Getty
「他人が売っている時に買い、誰もが買い進める時まで持つことだ。これは決してキャッチフレーズではない。投資で成功するためのエッセンスだ。」ーーJ Paul Getty
Something to think about the next time someone tells you to just “hold for the long term.”
今度誰かがあなたにこういうときにはちょっと考えて見れば良い、「株式は買って長く持つと良い。」
THE MONDAY MORNING CALL
月曜朝の目覚まし
All week investors have been hoping that the G-20 meeting would yield more Central Bank commitments for further monetary interventions to keep the “circus in town.” Unfortunately, Monday morning may see the markets under pressure as such hopes were left “wanting.”
週末投資家はG-20で中央銀行がさらなる見世物のような金融介入を進めることに期待する。残念なことに月曜の朝になればそのような期待は単なる「願望」にすぎない事を市場が教えてくれる。
Here is the key passage from Bloomberg:
“The G-20 members agreed to use monetary, fiscal and structural tools to boost growth, according to a final communique released in Shanghai on Saturday. Underscoring concerns over the limitations of central bank-led stimulus, ‘monetary policy alone cannot lead to balanced growth,‘ the document said.
「G-20参加国は成長のために、金融、財政そして構造改革を推進することで合意した、最終合意文章が土曜に上海で発表された。中央銀行主導の刺激策の限界がより明らかになった、”金融政策だけで安定成長を主導できない”と共同コミュニケは言う。
Leading into the meetings, Bank of England Governor Mark Carney warned counterparts against getting embroiled in a currency war by pushing interest rates too low, while International Monetary Fund Managing Director Christine Lagarde said the effects of monetary policies, even innovative ones, are diminishing.
会議を主導した、英国銀行総裁のMark Carneyは通貨戦争に巻き込まれる懸念を述べた、金利があまりに下がりすぎていると、一方IMF総裁のChristine Lagardeはたとえ非伝統的手段であろうとも金融政策の効果は失せてきていると言う。
With the U.K. mulling spending cuts, Japan planning a sales tax increase, Germany’s finance minister warning debt-funded growth just leads to ‘zombifying’ economies, and the U.S. constrained by a lame duck president and Republican-controlled Congress, it may fall to China to ratchet up the fiscal firepower.
英国は熟慮の上歳出を減らし、日本は消費前を増やそうとしている、ドイツ財務大臣は債務増加で「ゾンビ」経済が成長していると警告する、米国は大統領選を迎えレイムダック状態で、議会は共和党が主導する、結局中国にさらなる財政出動を期待する。
‘Investor hopes of coordinated policy actions proved to be pure fantasy,’ said David Loevinger, a former China specialist at the U.S. Treasury and now an analyst at fund manager TCW Group Inc. in Los Angeles. ‘It’s every country for themselves.'”
「投資家が期待する協調政策なんて夢物語だということが分かった、」と元米国財務省の中国専門家David Loevingerは言う、彼は現在TCWグループのファンドマネジャーだ。「各国それぞれに事情が異なる。」」
This is not likely to set well with investors as markets continue to deteriorate internally as shown in the market internal study below. (This is a monthly study, so only end-of-the-month closes are counted.)
投資家にとっては気分が良くないが、市場は内部劣化をつづけている。(このチャートは月次報告なので、月末の数値が書かれている。)
While the market is desperately clinging onto long-term moving average support currently, it is only barely doing so. What is clearly apparent is that despite “bullish hopes” that the recent correction has now ended, with all internal measures pointed lower this will likely prove not to be the case.
市場は長期のサポートラインを維持しようとしているように見えるが、かろうじてに過ぎない。明らかなことは最近の調整がもう終わったとする「強気願望」にもかかわらず、どのような指標を見てもさらなる下落を示唆しており、この願望が満たされそうにない。
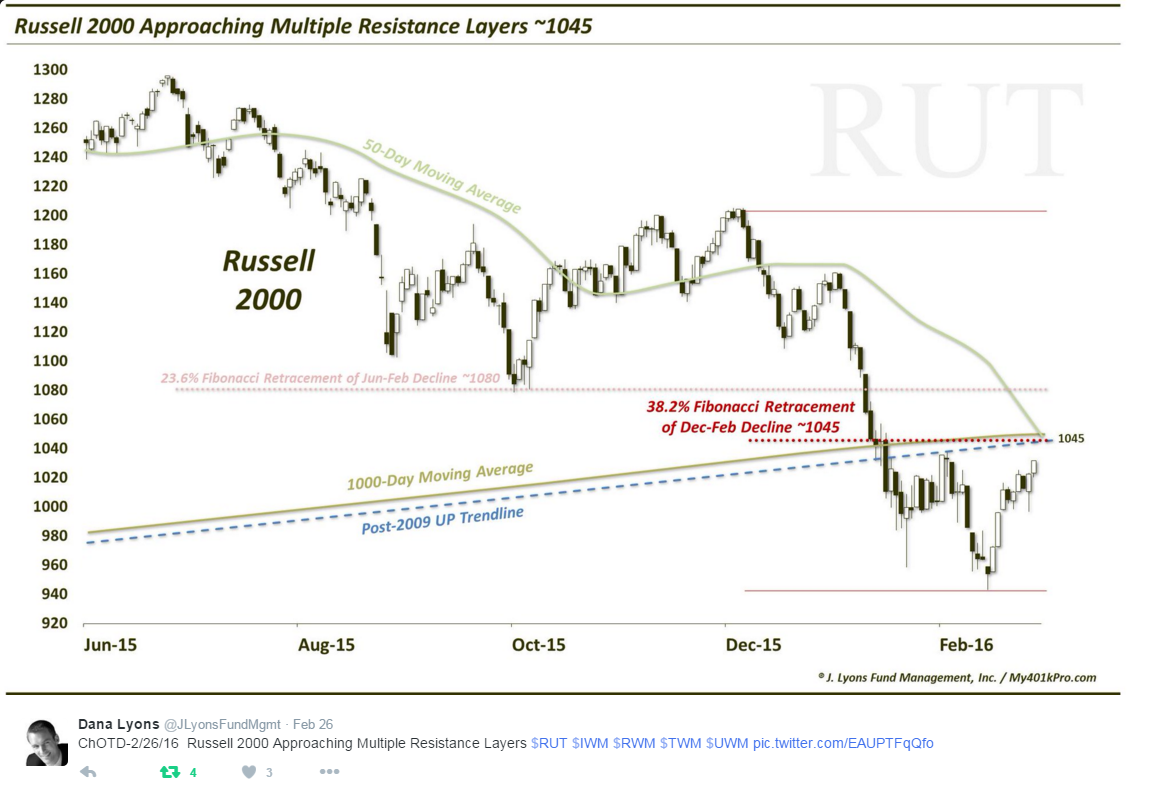
Dana Lyons
noted on Saturday that the Russell 2000, which has been under
considerably more downward pressure in recent months, is approaching
multiple layers of overhead resistance. A failure at those
resistance levels will continue to confirm the bearish trend in the
Russell 2000 which is already in a full-fledged bear market.
Dana Lyonsが土曜にRussell 2000について記事を書いた、この数ヶ月さらなる下落圧力がある、幾つもの抵抗線を破りつつある。これらの抵抗線を超えることはRussell 2000はのベア市場入りが本格化することを示している。
WAITING FOR CHANGE
変化を待つ
As stated two weeks ago in this weekly missive:
二週前にこの週報で書いたことだが:
“I recommended using any rally this week to move to the lowest level of equity exposure for this part of the cycle. (When the bear market is confirmed we will take portfolios to market neutral by hedging off any remaining equity risk, but we are not there as of yet.)
「私のお薦めはこうだ、今週のラリーで出来るだけ自分の株式を減らすと良い、今の景気サイクルを見れば解るだろう。(ベアマーケットが確認できれば株式リスクをヘッジするためにポートフォリをニュートラルにするだろう、しかしまだその時ではない。)
I suggest doing this by:
こういうふうにすると良い:
- Trimming back winning positions to original portfolio weights: Investment Rule: Let Winners Run
- Selling positions that simply are not working (if the position was not working in a rising market, it likely won’t in a declining market.) Investment Rule: Cut Losers Short
- Holding the cash raised from these activities until the next buying opportunity occurs. Investment Rule: Buy Low
- 買っている銘柄のポジションを初期に戻す:投資ルール:利益確定
- うまくいかない銘柄を売る(上昇相場で上がらない銘柄が下降相場で上昇するはずがない)投資ルール:損切り
- 次の買いチャンスまでキャッシュポジションを増やす:投資ルール:安く買う
As such there is now little for us to do except to wait, and watch patiently, for the market to either confirm a “bear market,” OR stabilize and begin to rebuild the bullish supports necessary to allow equity risk to once again be increased.
もう残された時間は少ない、辛抱強く待つことだ、「ベア相場」が確認されるまで、もしくはリバウンドで株式市場のリスクが許容レベルに達するまで。
Neither situation will make itself apparent in short order, so relax and we let the market dictate what actions we take next. “Guessing” at the markets has not typically been a successful and repeatable strategy.”
どちらも売りを見れば解る、リラックスして今後取るべき行動を市場に聞くと良い。市場への「期待」は成功への道ではない。」
So, for now, we continue to wait. When indicators begin to improve, and turn back into the positive, which could be next week, month, or year, such will be the indication “more constructive market dynamics” are in place increasing the reward/risk ratio. That is not now.
今は、待ちつづけるときなのだ。指数が改善し、ポジティブになれば、それは来週かも来月かも来年かもしれないが、「市場の建設的ダイナミックス」の証となり利益/リスク比がよくなる。今はその時ではない。
As investors, we should not be basing our investment decisions on “hope,” but rather an analysis of the evidence that would put the highest probability of “winning” in our favor. While you can certainly continue betting on “weak hands,” any good poker player will tell you that is a sure way to eventually go broke.
投資家は、「期待」に基づき投資判断をしてはならない、そうではなく「勝利」の可能性を証拠に基づき分析すべきだ。自分の手を過信しないポーカープレーヤーが確実に勝利をおさめることができる。


